Discover
Seeing is believing. Visualizations are critical to accurately communicate findings and achievements. Deciding which graph best displays your data and supports your analysis is fast and easy with Graph Builder.
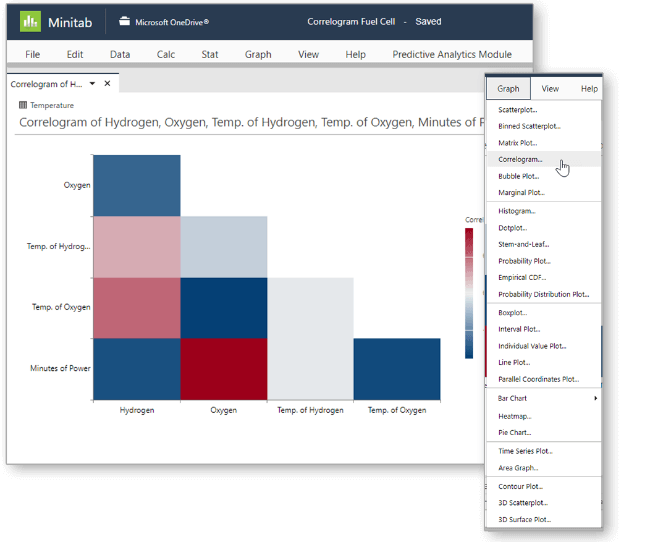
Our new interactive tool with an easy-to-browse gallery lets you view and explore multiple graph options without re-running your analysis. Using the same selection of data each time, Graph Builder seamlessly updates from bar charts to correlograms to heat maps and more, so you can focus on choosing the best visual for your insights.