Minitab Statistical Software
Visualize, analyze, and harness the power of your data to solve your toughest business challenges from anywhere on the cloud.
Harness the power of statistics.
Data is everywhere, but are you truly taking advantage of yours? Minitab Statistical Software can look at current and past data to discover trends, find and predict patterns, uncover hidden relationships between variables, and create stunning visualizations to tackle even the most daunting challenges and opportunities.
With powerful statistics, industry-leading data analytics, and dynamic visualizations on your side, the possibilities are endless.
Discover
Regardless of statistical background, Minitab empowers all parts of an organization to predict better outcomes, design better products, and improve processes to generate higher revenues and reduce costs. Only Minitab offers a unique, integrated approach by providing software and services that drive business excellence from anywhere with the cloud.
Key statistical tests include t tests, one and two proportions, normality test, chi-square, and equivalence tests.
Access new levels of productivity and collaboration, whether you are using Minitab on your desktop or the cloud. See how >
Predict
Access modern data analysis and explore your data even further with our advanced analytics. Skillfully predict, compare alternatives, and forecast your business with ease using our revolutionary predictive analytics techniques.
Use classical methods in Minitab Statistical Software, integrate with open-source languages R or Python, or boost your capabilities further with machine learning algorithms like Classification and Regression Trees (CART®), TreeNet® and Random Forests®, now available in Minitab’s Predictive Analytics Module.
Discover
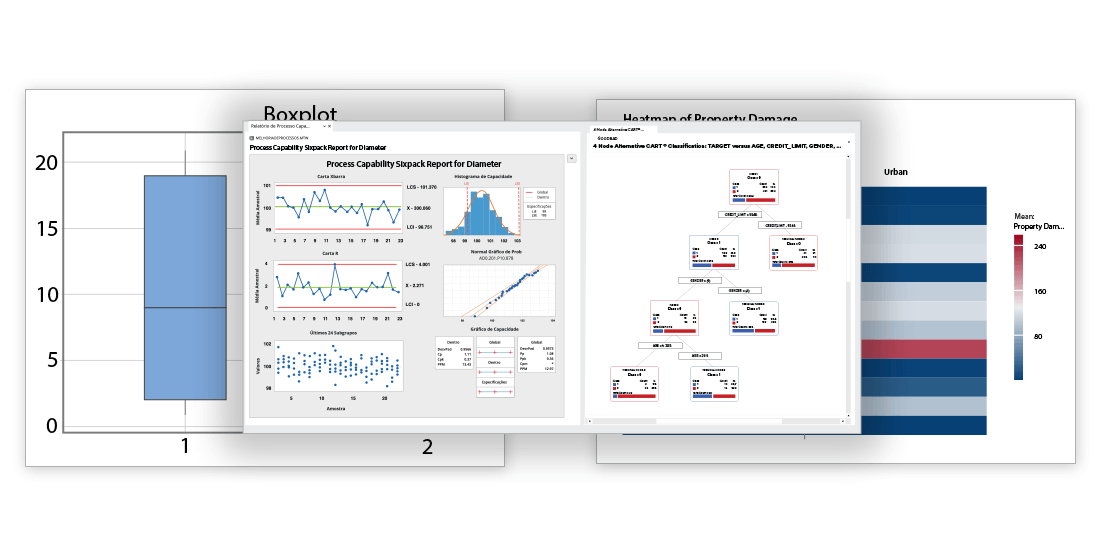
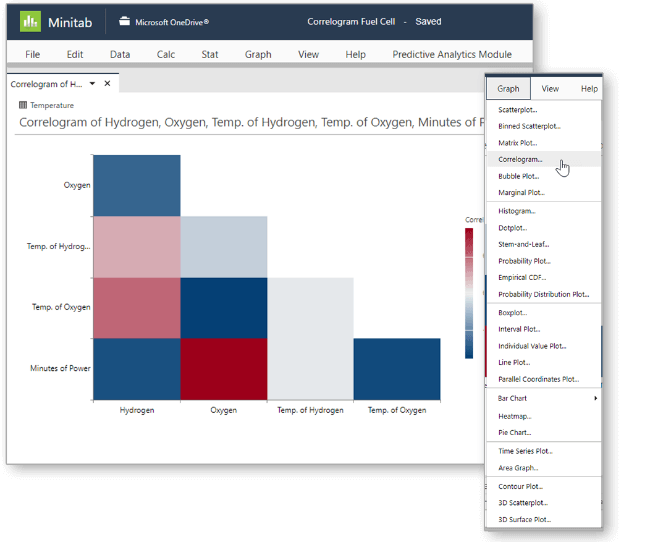
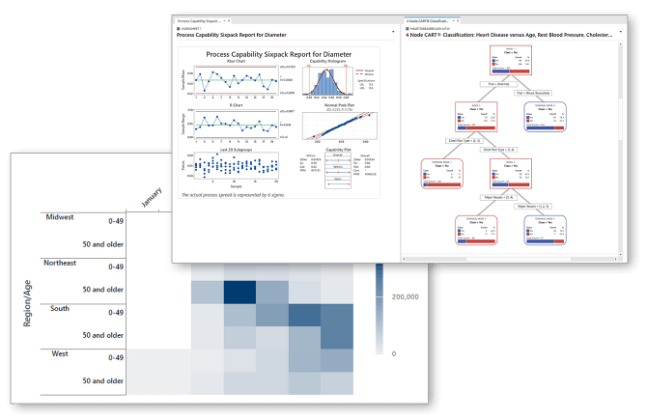
Seeing is believing. Visualizations are critical to accurately communicate findings and achievements. Deciding which graph best displays your data and supports your analysis is fast and easy with Graph Builder.
Our new interactive tool with an easy-to-browse gallery lets you view and explore multiple graph options without re-running your analysis. Using the same selection of data each time, Graph Builder seamlessly updates from bar charts to correlograms to heat maps and more, so you can focus on choosing the best visual for your insights.
Measurement System Analysis
- Gage studies
- Attribute agreement analysis
Control Charts
- Variable, attribute
- Multivariate
- Time weighted
- Rare event charts
Capability Analysis
- Capability Sixpack
Acceptance Sampling
Tolerance Intervals
Distribution Analysis
- Arbitrary censoring (left, right or interval censoring)
- Weibull analysis
- Censored data
Test Plans
- Demonstration
- Estimation (sample size for distribution analysis)
- Accelerated Life Test
Warranty Analysis
Reparable Systems Analysis
Regression with Life Data
Probit Analysis
Design of Experiments (DOE)
- Screening designs
- Full factorial
- Fractional factoria
- Response surface
- Mixture
- Taguchi
Power and Sample Size
- Tolerance Intervals
- Normal and non-normal distribution
Correlation
Statistical Modeling (DOE)
- Regression
- Nonlinear regression
- Multivariate models
- Cluster analysis
- Classification and Regression Trees (CART®)
- TreeNet®
- Random Forests®
Time Series Analytics
- ARIMA modeling
- Time series / forecasting
Visualizations
- Heatmaps
- Boxplots
Multivariate Methods
Chi-Square Test for Association
Stage 1: Process Design
- Measurement systems analysis
- Hypothesis testing
- Regression / ANOVA
- Process Capability
Stage 2: Process Qualification
- Control charts
- Capability analysis
- Tolerance Intervals
Stage 3: Continued Process Validation
- Measurement system analysis
- Acceptance sampling
- Control charts
Multivariate Methods
Chi-Square Test for Association
Grow Your Skills
Education Hub
On-site or Virtual Training
Statistical Consulting
Ready to discover Minitab Statistical Software?
Free Trial or Purchase Now
Start your Solutions Analytics™ journey today with a free trial of select Minitab products! Access all the powerful capabilities, latest enhancements, and new features that Minitab
has to offer with each trial.
Support
Access the help you need to use our software from representatives who are knowledgeable in statistics, quality improvement,
and computer systems.
Datatools
2902 Marina Plaza Al Marsa Street
PO Box 334155
Dubai – United Arab Emirates
Phone: +971(4) 2780994
Email: futureskills@datatools.me